Status of Human Footprint in Alberta.

Browse through the status and trend of human footprint in Alberta (circa 2021) at the provincial scale, and broken down by administrative and ecological units.
Updated November, 2023

Introduction

Human land use is pervasive across the planet.

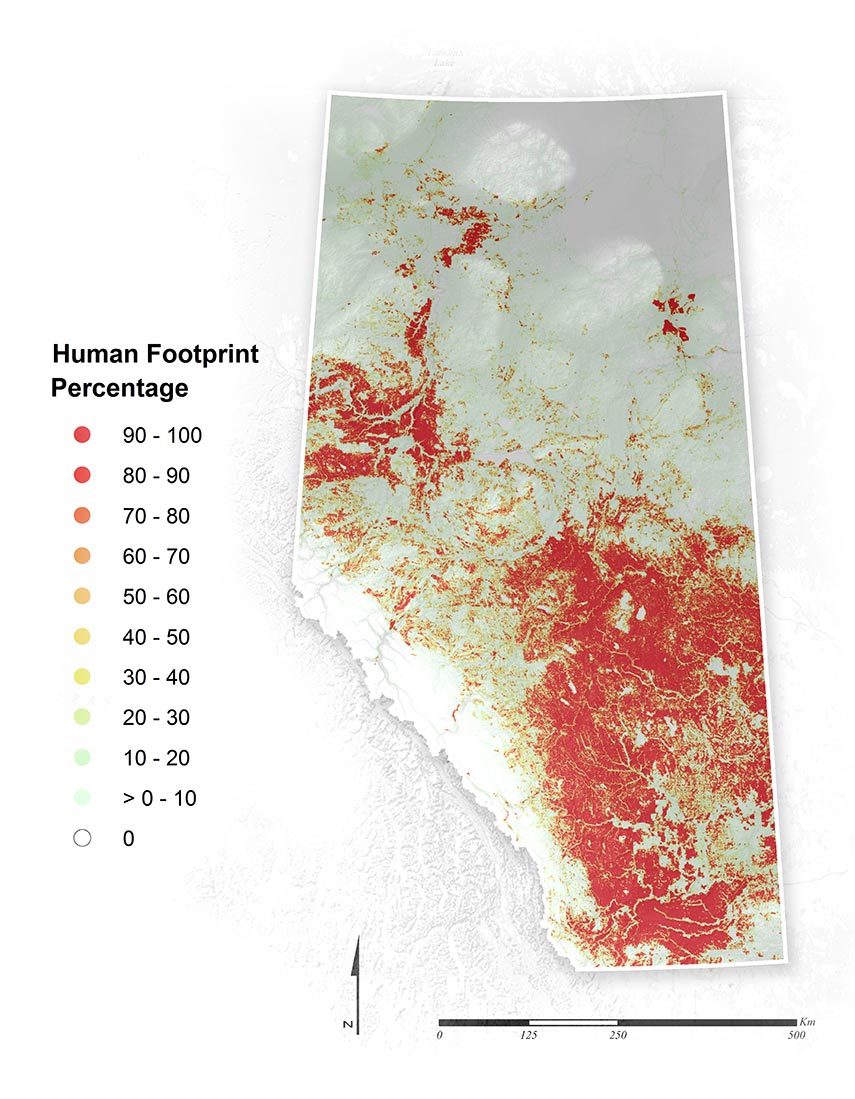
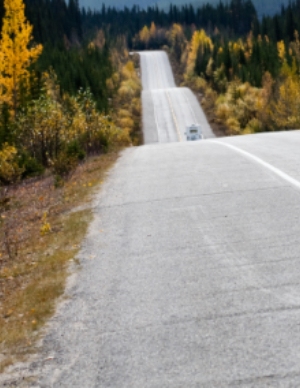
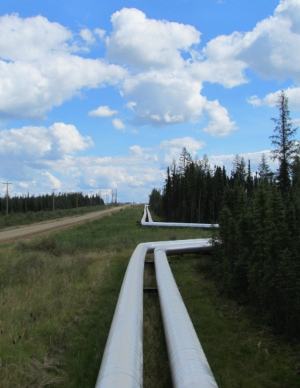
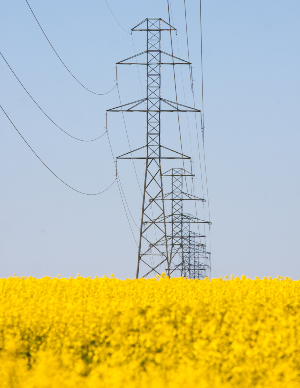
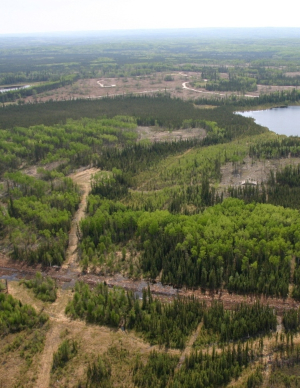
We transform natural landscapes for a variety of purposes—to grow food, to extract timber and fossil fuels, to make way for new housing developments, or to build road and rail systems to transport people and goods. The extent of human land use in any given area is collectively defined as human footprint.[1,2] Measuring human footprint information is increasingly being used as a land-use planning tool to monitor the status and change of landscapes.[3]

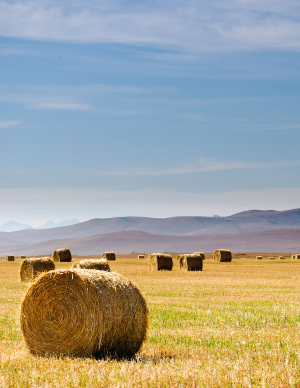
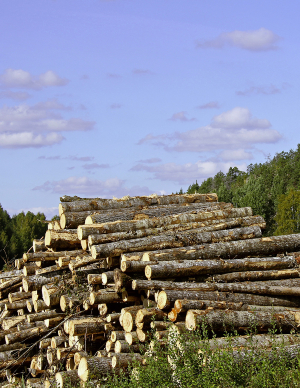
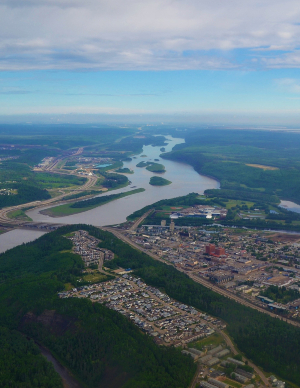
During the past century, the availability of natural resources in Alberta has defined human land use patterns, in both time and space. The province was considered a farming frontier in the late 1800s, and most of Alberta’s human footprint in the central and southern parts of the province is the result of this farming legacy. While agriculture remains important, other human land uses, particularly forestry and oil and gas development, have expanded in recent decades into previously undisturbed areas in the Foothills and Boreal Forest Natural Regions. To meet Alberta’s growing population needs, urban areas have expanded to keep up with industrial growth. As these activities continue, understanding and managing their cumulative effects on biodiversity are priorities in Alberta.

In this report, we summarize the status and trend of human footprint (circa 2021) as well as the density of linear features throughout Alberta. We provide an overview of human footprint at the provincial scale but also break down the information by natural region, Land-use Framework Planning Region, and Oil Sands Region. These results are updated biennially.

Definition

Defining human footprint

The ABMI defines human footprint as the visible alteration or conversion of native ecosystems to temporary or permanent residential, recreational, agricultural, or industrial landscapes. The definition includes all areas under human use that have lost their natural cover for extended periods of time, such as cities, roads, agricultural fields, and surface mines. It also includes land that is periodically reset to earlier successional conditions by industrial activities such as forestry cutblocks and seismic lines. Some human land uses, such as grazing, hunting, and trapping, are not yet accounted for in our human footprint analyses.

Measuring Human Footprint

Measuring Alberta's human footprint

The ABMI monitors the status of Alberta’s human footprint using satellite imagery at two spatial scales:

1
3 × 7-KM SAMPLES

The ABMI uses human footprint data measured annually at a 1:5,000 scale to track changes in human footprint over time. The year features originated is based on a series of satellite imagery sources as well as outside data sources provided by our partners. Detailed annual samples of human footprint are measured in a 3 × 7-km rectangular area centered near each of the ABMI’s 1,656 long-term sites, which when summed across all sites amounts to about 5% of the province’s land surface. ABMI's human footprint trend data are available from 2000 to 2021, except for 2002 and 2003. Trend data and the metadata associated with these data can be accessed here.

FIGURE: A detailed inventory of human footprint is created annually for a 3 × 7 km area located near each ABMI site.

2
PROVINCIAL SCALE

At the provincial scale, the ABMI merges 20 human footprint sub-layers (based on 114 feature types) into a single integrated layer by applying a specific order of precedence to create the ABMI Human Footprint Inventory (HFI), circa 2021. The year features originated is based on a series of satellite imagery sources as well as outside data sources provided by our partners. In addition to the polygonal representation of human footprint feature types, the HFI 2021 dataset also represents the centerlines of linear features (polylines), including pipelines, roads, railways, transmission lines, and seismic lines.

To view the distribution of each of the sub-layers in Alberta, hover over each of the layers in the table below. Some of these 20 sub-layers are created by the ABMI and Government of Alberta as part of the Alberta Human Footprint Monitoring Program. In this report, we use the HFI 2021 to:

  • report on the current status of human footprint;
  • generate maps of human footprint;
  • standardize the 3 × 7-km trend estimates before reporting; 
  • calculate total footprint in regions where there are insufficient sample sites to estimate trends using the 3 × 7-km data.

This product is updated approximately every two years; these data and the metadata associated with this product are available here.

TABLE: Order of precedence applied to human footprint sub-layers to create the ABMI HFI. Hover over a sub-layer to view its distribution.

1 Reservoirs
2 Borrow Pits, Sumps, Dugouts and Lagoons
3 Non-vegetated Impermeable Surfaces (Roads)
4 Rail Lines Hard Surface
5 Canals
6 Vegetated Surfaces of Roads, Trails and Railways
7 Mine Sites
8 Industrial Sites
9 Well Sites (Energy) ACTIVE
10 Landfill
11 Other Vegetated Facilities and Recreation
12 Wind Generation Facility
13 Transmission Lines
14 CFO and other High Density Livestock
15 Urban and Rural Residential
16 Well Sites (Energy) ABANDONED
17 Cultivation
18 Cut Blocks
19 Pipelines
20 Seismic Lines

Measuring Recovery of Successional Footprint

Recovery of Alberta's forestry footprint

As a successional footprint, forestry recovers with time after disturbance. Defined as "Forestry, Net" in this report—we account for the recovery of forestry footprint using biotic recovery curves based on a literature review.[4]

BIODIVERSITY RECOVERY VALUES

Biodiversity recovery values for forestry are based on a review of the recovery of forest species in harvest areas of different ages.[4] A newly harvested area is considered to be 0% recovered, while a mature forest is 100% recovered. Field studies of the abundance of species in harvest areas of different ages were used to fill in the recovery curve between those two benchmarks. The results showed faster recovery in deciduous forest than in conifer forest, so we used different recovery curves for the two forest types; see recovery values in Table below for coniferous and deciduous forest. Age of forest harvest areas is based on age information assigned to each polygon during human footprint delineation. The Harvest Areas [YEAR] value is the best estimation of the year when the area was harvested. It has been determined by:

  • HFI 2021 heads up digitization for years 2014 to 2021, 
  • combination of source data values and remote sensing analysis for years 1985 to 2013, and, 
  • source data based for years prior to 1985.

We do not yet have information on the recovery of other types of human footprint.

CALCULATING "FORESTRY, NET" AREA

We report on the recovery of forestry footprint—i.e. the "Forestry, Net" area—by prorating the harvest area for how much it has recovered for biodiversity, based on its age and stand type (deciduous or conifer). For example, a 10-ha harvest area that is at an age where it is 36.8% recovered would have a "Forestry, Net" value of 6.32 ha (=10ha * (100-36.8%)). The idea is that the harvest area would have biodiversity equivalent to 6.32 ha of a recent, unrecovered clearcut plus 3.68 ha of mature forest.

To do the calculation, we use GIS to summarize the area of each harvest area, its age (years since harvest), and stand type (deciduous or conifer). We group the ages into classes of 0-9 yr, 10-19 yr, 20-39 yr, 40-59 yr, 60-79 yr, and 80+ yr. Based on the age class and stand type, we multiply the area of each harvest unit by the Effective Human Footprint Area (EHFA) factor in the table below, to get the Forestry, Net value of that unit.

Table: Footprint Recovery. Biodiversity recovery of deciduous and conifer stands by age class. EHFA = Effective Human Footprint Area.

Stand Type Age Class (yr) Biodiversity Recovery (%) EHFA Factor (%)
Deciduous 0-9 0.0 100.0
  10-19 36.8 63.2
  20-39 58.2 41.8
  40-59 83.1 16.9
  60-79 93.2 6.8
  80+ 100.0 0.0
Coniferous 0-9 0.0 100.0
  10-19 8.0 92.0
  20-39 24.8 75.2
  40-59 64.7 35.3
  60-79 83.9 16.1
  80+ 100.0 0.0

Members of the University of Calgary's Applied Geospatial Research Group contribute to the ongoing research around footprint recovery. 

Reporting on Human Footprint

Human footprint categories for reporting

Status & Trend Reporting Categories

The status of human footprint was reported using summaries of human footprint categories from the HFI 2021. The trend in human footprint for each area of interest was assessed using the 3 × 7-km detailed inventory of human footprint available from 2000 to 2021, except for 2002 and 2003. Status and trend are presented for total human footprint and the following six reporting categories:

 Agriculture Footprint

Areas of annual or perennial cultivation, including crops, tame pasture, confined feeding operations, and other high-density livestock areas. This category also includes peat mines—areas of surface disturbance mined for peat which is used in gardening.

Energy Footprint
           (Mines, Wells, & Other Energy Features)

Areas where vegetation or soil has been disturbed by footprint types associated with the energy sector, including mine sites, pipelines, seismic lines, transmission lines, well sites, and wind-generation facilities. This category also includes industrial facilities related to the oil and gas sector, such as refineries, plants, compressor stations, and flare stacks. 

Forestry Footprint

Areas in forested landscapes where timber resource extraction has occurred for industrial purposes, including clear-cut and partial-cut logging methods.

Transportation Footprint

Railways, roadways, and trails with hard surfaces such as concrete, asphalt, or gravel; roads or trails without hard surfaces; and the vegetation strips alongside transportation features.

Urban/Industrial Footprint
           (Urban, Rural, & Industrial Features)

Residences, buildings, and disturbed vegetation and substrate associated with urban and rural settlements, such as housing, shopping centres, industrial areas, golf courses, and recreation areas, as well as bare ground cleared for industrial and commercial development. This category does not include industrial facilities associated with the oil and gas industry; these feature types are included in the Energy Footprint category.

Human-created Waterbodies

Waterbodies created for a variety of purposes, such as to extract fill (borrow-pits, water treatment), water livestock (dugouts), transport water (canals), meet municipal needs (water supply and sewage), and store water (reservoirs).


Recovery Reporting Categories

To account for the successional recovery of forestry footprint, we also prorate each harvest area for how much it has recovered to support biodiversity, which results in a smaller footprint. This is reported as:

Forestry, Net

The area of forestry footprint prorated for how much it has recovered for biodiversity, based on harvest area age and stand type (deciduous or conifer). A newly harvested area is considered to be 0% recovered, while mature forest is 100% recovered.

Linear Footprint Reporting Categories

Linear disturbance is summarized as the density of linear footprint in km per km2. Linear density is presented for total linear density, and by five linear feature types:

Seismic Line (Conventional)

Conventional seismic lines, also referred to as legacy seismic lines, were constructed prior to the use of Low-Impact-Seismic (LIS) construction methods. Conventional seismic lines were constructed using older technology that required the lines to be between 5 to 8 meters in width to allow equipment to operate on the lines. Many of these lines were also constructed prior to the widespread use of GPS in surveying and as a result the surveyors required a line of sight to locate the lines and associated events along the lines.

Transmission Lines

Utility corridor greater than 10 meters wide with poles, towers, and lines for transmitting high voltage (> 69 kV) electricity.

Railway

Corridors created for railways, as well as the physical clearing around the railway. 

Pipelines

A line of underground and overground high-pressure pipes, used for the delivery of fluids such as petrochemicals, as well as the physical clearing around the pipelines.

Roads

Roadways paved with asphalt or concrete, roads surfaced with gravel and which serve as a main access route, as well as airplane runways and interchange ramps. Included are roads surfaced with dirt and/or low vegetation which serve as minor access routes.


Mapping

The maps used to visualize human footprint in this report are based on the GIS Inventory of Provincial Human Footprint, circa 2021.

References

1. Sanderson E.W., J. Malanding, M.A. Levy, K.H. Redford, A.V. Wannebo, and G. Woolmer. 2002. The human footprint and the last of the wild: the human footprint is a global map of human influence on the land surface, which suggests that human beings are stewards of nature, whether we like it or not. Bioscience 52(10):891-904.

2. Leu M., S.E. Hanser, and S.T. Knick. 2008. The human footprint in the west: a large-scale analysis of anthropogenic impacts. Ecological Applications 18(5):1119-1139.

3. Haines A.M., M. Leu, L.K. Svancara, J.M. Scott, and K.P. Reese. 2008. A theoretical approach to using human footprint data to assess landscape level conservation efforts. Conservation Letters 1:165-172.

4. Huggard D. and L. Kremsater. 2015. Human footprint recovery for the Biodiversity Monitoring Framework— quantitative synthesis. Unpublished report.